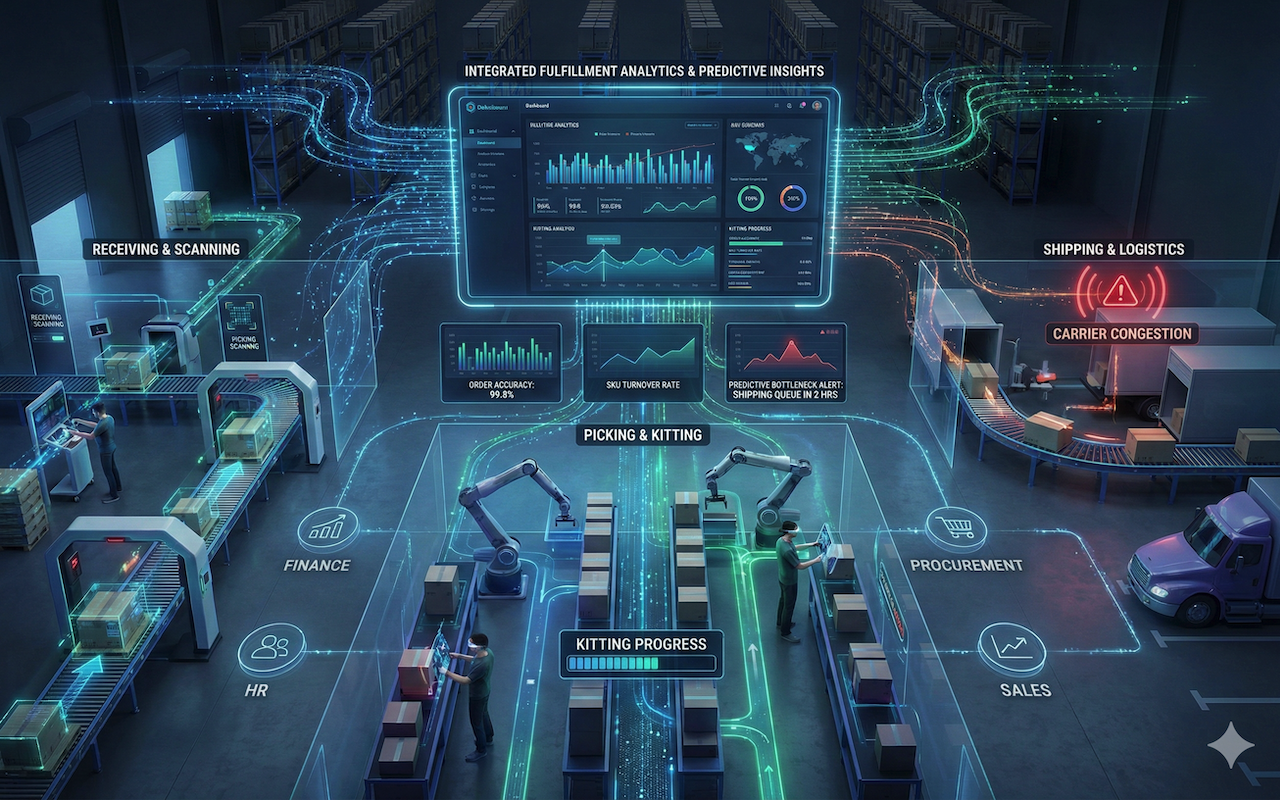
Next-generation analytics leverage scan data, records from warehouse and transport systems, and the timing of each process step to identify which receiving, picking, kitting, or shipping activities are underperforming. Standardized metrics and real-time dashboards across sites and shifts enable more effective performance comparisons. As delivery windows shorten and costs increase, deploying labor and inventory must be more exact.
Predictive alerts identify potential operational disruptions caused by increased queue lengths, carrier congestion, or stock shortages. With consistent data collection, operational gaps stemming from automation and layout/design changes, as well as training, can be addressed. Continuous improvement in day-to-day warehouse management relies on dependable data streams, prioritized performance measurement, predictive models, and regular performance reviews.
The Importance of Complete Visibility in Kitting and Fulfillment
Complete visibility across kitting and fulfillment enables precise tracking of materials and tasks. Complete traceability of materials and activities is only possible with full visibility across kitting and fulfillment. Each scan recorded at the receiving, picking, assembly, and outbound shipping stages creates an event chain that can be traced.
Time stamps reveal how long items spend at each step and help identify processes that slow down and may benefit from layout/design changes or staffing optimization. With a single dashboard that integrates data across the warehouse, transport, and the enterprise, monitoring and decision-making can occur much more quickly.
Shared metrics enable consistent comparisons across locations without tedious manual data cleaning. Automated notifications about pending scans or lengthening queues help managers preemptively assign other tasks to employees or initiate a refill in situ to avoid backlogs. We recommend starting with a single integrated dashboard to assess data accuracy, then expanding interconnections to achieve visibility in a controlled manner.
Selecting Performance Metrics That Provide Insight Into Operational Deficiencies
Metrics such as order accuracy, distance travelled, and stock-keeping unit (SKU) turnover demonstrate the layout and slotting problems that are driving cycle times to be abnormally high. Analyzing pick rate misses in relation to the average distance travelled during a pick cycle helps identify inefficient or entirely blocked pathways. A comparison of turnover rate with bin volume helps identify underperforming storage that leads to longer cycle times due to more frequent restocking.
Measuring total touches per item helps identify excessive and inefficient handling, which, in turn, increases your labor costs. Differentiating task completion time across various time spans helps identify inefficiencies at the process level versus those within individual employee performance. The result helps identify areas where a layout needs more refined slotting or path design, or where additional training intervention should be focused. These focused metric evaluations help remove ineffective actions, increase reliability in actions taken across workstations, and enable level data-driven changes to business cycle times.
How Predictive Triggers Help Prevent Warehousing Bottlenecks
Predictive analytics, event data, and historical trends can be used to generate predictive alerts for potential slowdowns. Order volume and shipping carrier schedules can help planners predict when shipping queue bottlenecks may occur and when adjustments are needed. Automated alerts when order volume increases or stock levels decrease allow supervisors to make timely shipping adjustments.
Integrating predictive analytics into workforce management systems allows employers to flexibly shift employees between receiving, picking, and packing based on workload and system demand. This minimizes excess overtime and balances volume. Start with predefined alert thresholds and staffing templates, then adapt as needed to achieve your desired responsiveness. Predictive triggers can be incorporated into standard processes to improve responsiveness and prevent demand-planning bottlenecks.
How Fulfillment System Intelligence Enriches Cross-Company Decision Making
When every team has access to fulfillment data, the link between warehouse operations and overall business performance is strengthened. Variability in lead time from suppliers and reliability scores allows the procurement team to manage sourcing and safety stock levels. The finance team can improve budget management by linking delays on the critical path to cost delays and prioritizing investments accordingly. Accurate delivery time data enables marketing and sales teams to set realistic delivery commitments and reduce order disappointment and cancellations.
Human resources can identify throughput and error rates by division and adjust staffing and training programs accordingly. Shared dashboards provide a single verified source of information for report generation, resource planning, and budget allocation. Integrated visibility enables each division to make coordinated, informed decisions that improve service reliability, cost efficiency, and overall operational performance.
Embedding Warehouse Management Analytics Into Practice
Regular use of analytics allows employees to take ownership of their own report outcomes. Reviewing analytics before each work session begins helps employees focus on their metrics for that session. A short scorecard outlining three goals and their owners can help to focus each group. Accountability can be improved through bonuses and rewards for metrics that can be directly measured, such as picking accuracy, packing speed, and handling time.
Keeping a changelog of adjustments and outcomes encourages continuous improvement. Staff can respond more quickly to exceptions when KPIs are available in real time on screens or mobile devices. Continuing to embed analytics into operational decisions will help improve speed, accuracy, and consistency of core operational metrics.
Conclusion
Predictive analytics creates more manageable fulfillment data. With scan, management, and carrier data available, teams can monitor cycle times and resource usage more effectively. Predictive models forecast workloads and bottleneck areas. Standardized bottom lines allow for data comparisons across fulfillment sites. Small pilot programs analyzing cost-per-delay and handling-time data will confirm each metric’s value. Streamlined data, dashboard, and review habits create faster response and more consistent operations. This measurement approach creates clear fulfillment, improving supply chain productivity.
Featured Image generated by Google Gemini.
Share this post
Author

Read the latest articles from Kylie Miler
Artificial Intelligence in Business: Planning, Building, and Scaling AI Effectively

January 8, 2026
Artificial intelligence is reshaping how businesses operate, compete, and grow. From automating internal processes to enabling data-driven decision-making, AI has become a practical component of modern business strategy. However, successful adoption requires more than selecting tools or hiring developers. [...]
Learn moreHow PPC Can Help a New Subscription Business Grow Fast

December 24, 2025
In a competitive digital landscape, new subscription businesses face a common problem: attracting attention quickly enough to build momentum. Unlike one-time purchases, subscriptions depend on a steady pipeline of qualified customers who are willing to commit and stay. Pay-Per-Click (PPC) advertising can be a pow [...]
Learn moreLeave a comment
All comments are moderated. Spammy and bot submitted comments are deleted. Please submit the comments that are helpful to others, and we'll approve your comments. A comment that includes outbound link will only be approved if the content is relevant to the topic, and has some value to our readers.
Comments (0)
No comment