
Every second, servers across the internet generate millions of log entries—cryptic lines of text documenting every connection, request, and error. For network administrators, security analysts, and digital forensics investigators, these IP logs contain invaluable intelligence about traffic patterns, security threats, and system performance. The challenge isn't collecting the data; it's transforming raw log files into actionable insights.
While specialized log analysis tools like Splunk, ELK Stack, and Graylog offer powerful capabilities, they require significant investment, technical expertise, and infrastructure. For many professionals—small business IT managers, freelance security consultants, researchers, and analysts working with limited budgets—Excel provides a surprisingly capable alternative for IP log analysis.
Understanding IP Log Structure
Before analyzing logs, you need to understand their structure. Most web server and network logs follow standard formats, though variations exist based on the server software and configuration.
Apache Combined Log Format (one of the most common)
192.168.1.100 - - [15/Apr/2026:13:42:17 +0000] "GET /index.html HTTP/1.1" 200 2326 "https://google.com" "Mozilla/5.0"
This single line contains:
- IP address: 192.168.1.100 (who made the request)
- Timestamp: 15/Apr/2026:13:42:17 (when)
- Request method and resource: GET /index.html (what they wanted)
- HTTP status code: 200 (success/failure indicator)
- Bytes transferred: 2326 (data volume)
- Referrer: Where the visitor came from
- User agent: Browser/device information
Nginx logs, IIS logs, and firewall logs follow similar patterns with variations in field order and separator characters. Understanding your specific log format is essential before importing it into a spreadsheet.
Importing Logs and Getting Clean Data
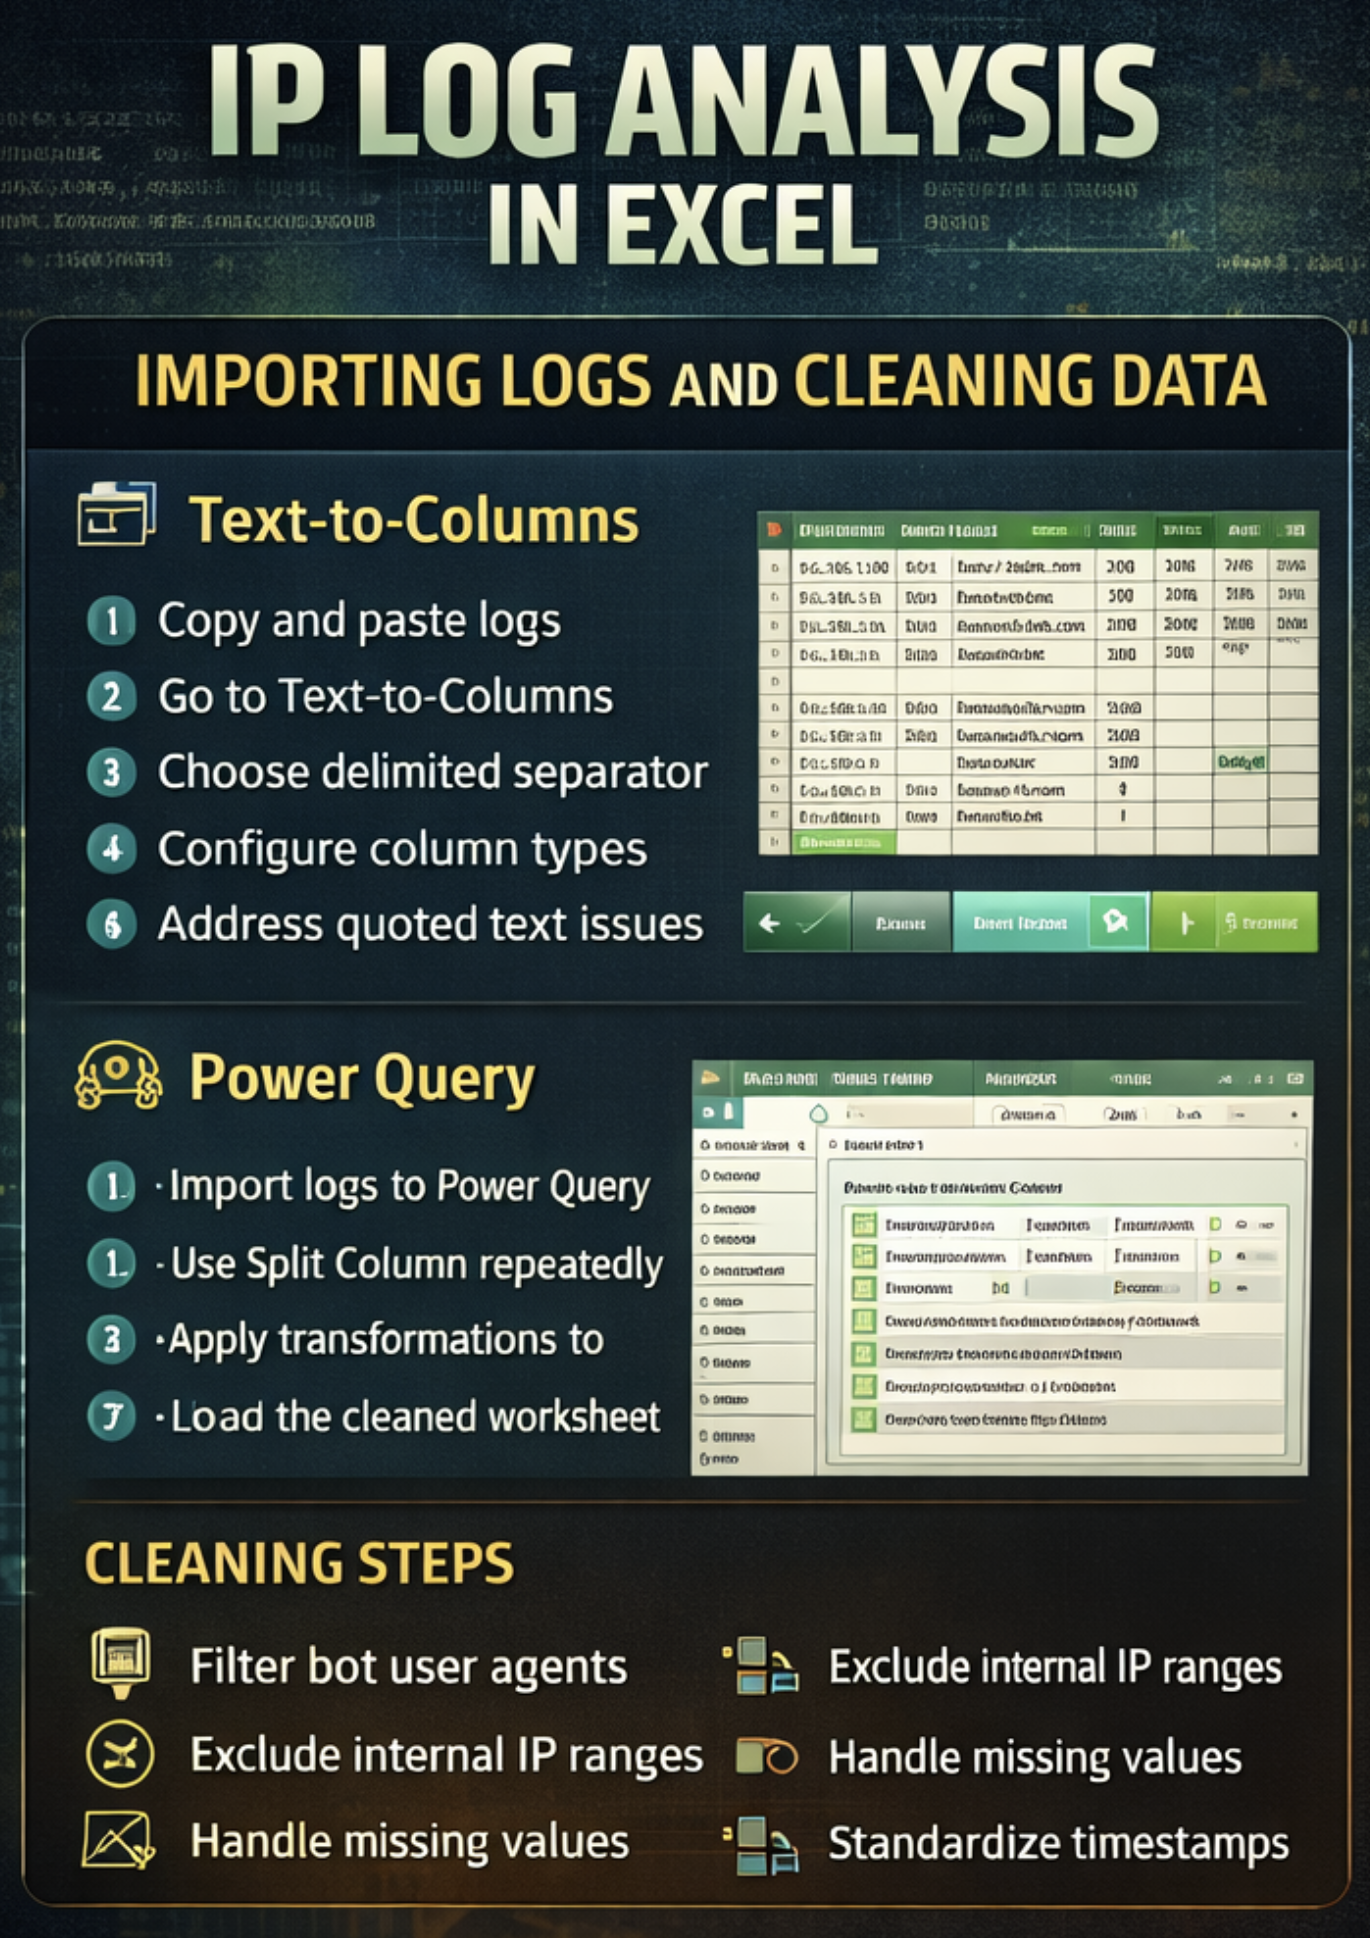
Image generated by ChatGPT.
Method 1: Text-to-Columns with Delimiters
For logs using consistent delimiters (spaces, tabs, or custom characters):
- Copy log entries from your text file
- Paste into Excel (column A will contain entire log lines)
- Select the data and navigate to Data > Text to Columns
- Choose "Delimited" and specify your separator (usually space for Apache/Nginx)
- Configure column data types (text for IP addresses to preserve leading zeros)
This method works well for simple, consistently formatted logs, but struggles with logs that contain quoted strings with internal spaces.
Method 2: Power Query for Complex Parsing
For more complex log formats, Power Query offers superior parsing capabilities:
- Data > Get Data > From File > From Text/CSV
- Load the log file, but click "Transform Data" instead of "Load"
- Use "Split Column" functions repeatedly to parse fields
- Apply transformations to clean data (remove quotes, convert timestamps, extract components)
- Load the worksheet once parsing is complete
Power Query preserves your parsing steps, allowing you to refresh data as new logs arrive without manual re-parsing.
IP Address Formatting
Excel can misinterpret IP addresses as numbers. "192.168.001.100" might become "192.168.1.1" when treated numerically. Always format IP address columns as Text before or immediately after importing to preserve the original values exactly.
Essential Data Cleaning Steps
Raw logs contain noise that obscures patterns. Clean data before analysis:
- Remove bot traffic: Filter out known bot user agents (Googlebot, Bingbot, etc.) if analyzing human traffic patterns. Create a filter column using formulas like: =IF(ISNUMBER(SEARCH("bot",[@[User Agent]])), "Bot", "Human")
- Exclude internal IP ranges: Your own monitoring systems, internal testing, and administrative access shouldn't inflate traffic analysis. Filter out private IP ranges (10.x.x.x, 172.16.x.x-172.31.x.x, 192.168.x.x).
- Handle missing values: Logs sometimes contain dashes or null values for referrer or user agent fields. Decide whether to exclude these entries or categorize them separately.
- Standardize timestamps: Convert log timestamps to Excel date/time values to enable proper sorting and time-based analysis. This often requires text-manipulation functions to extract components, then reassemble them.
Core Analysis Techniques
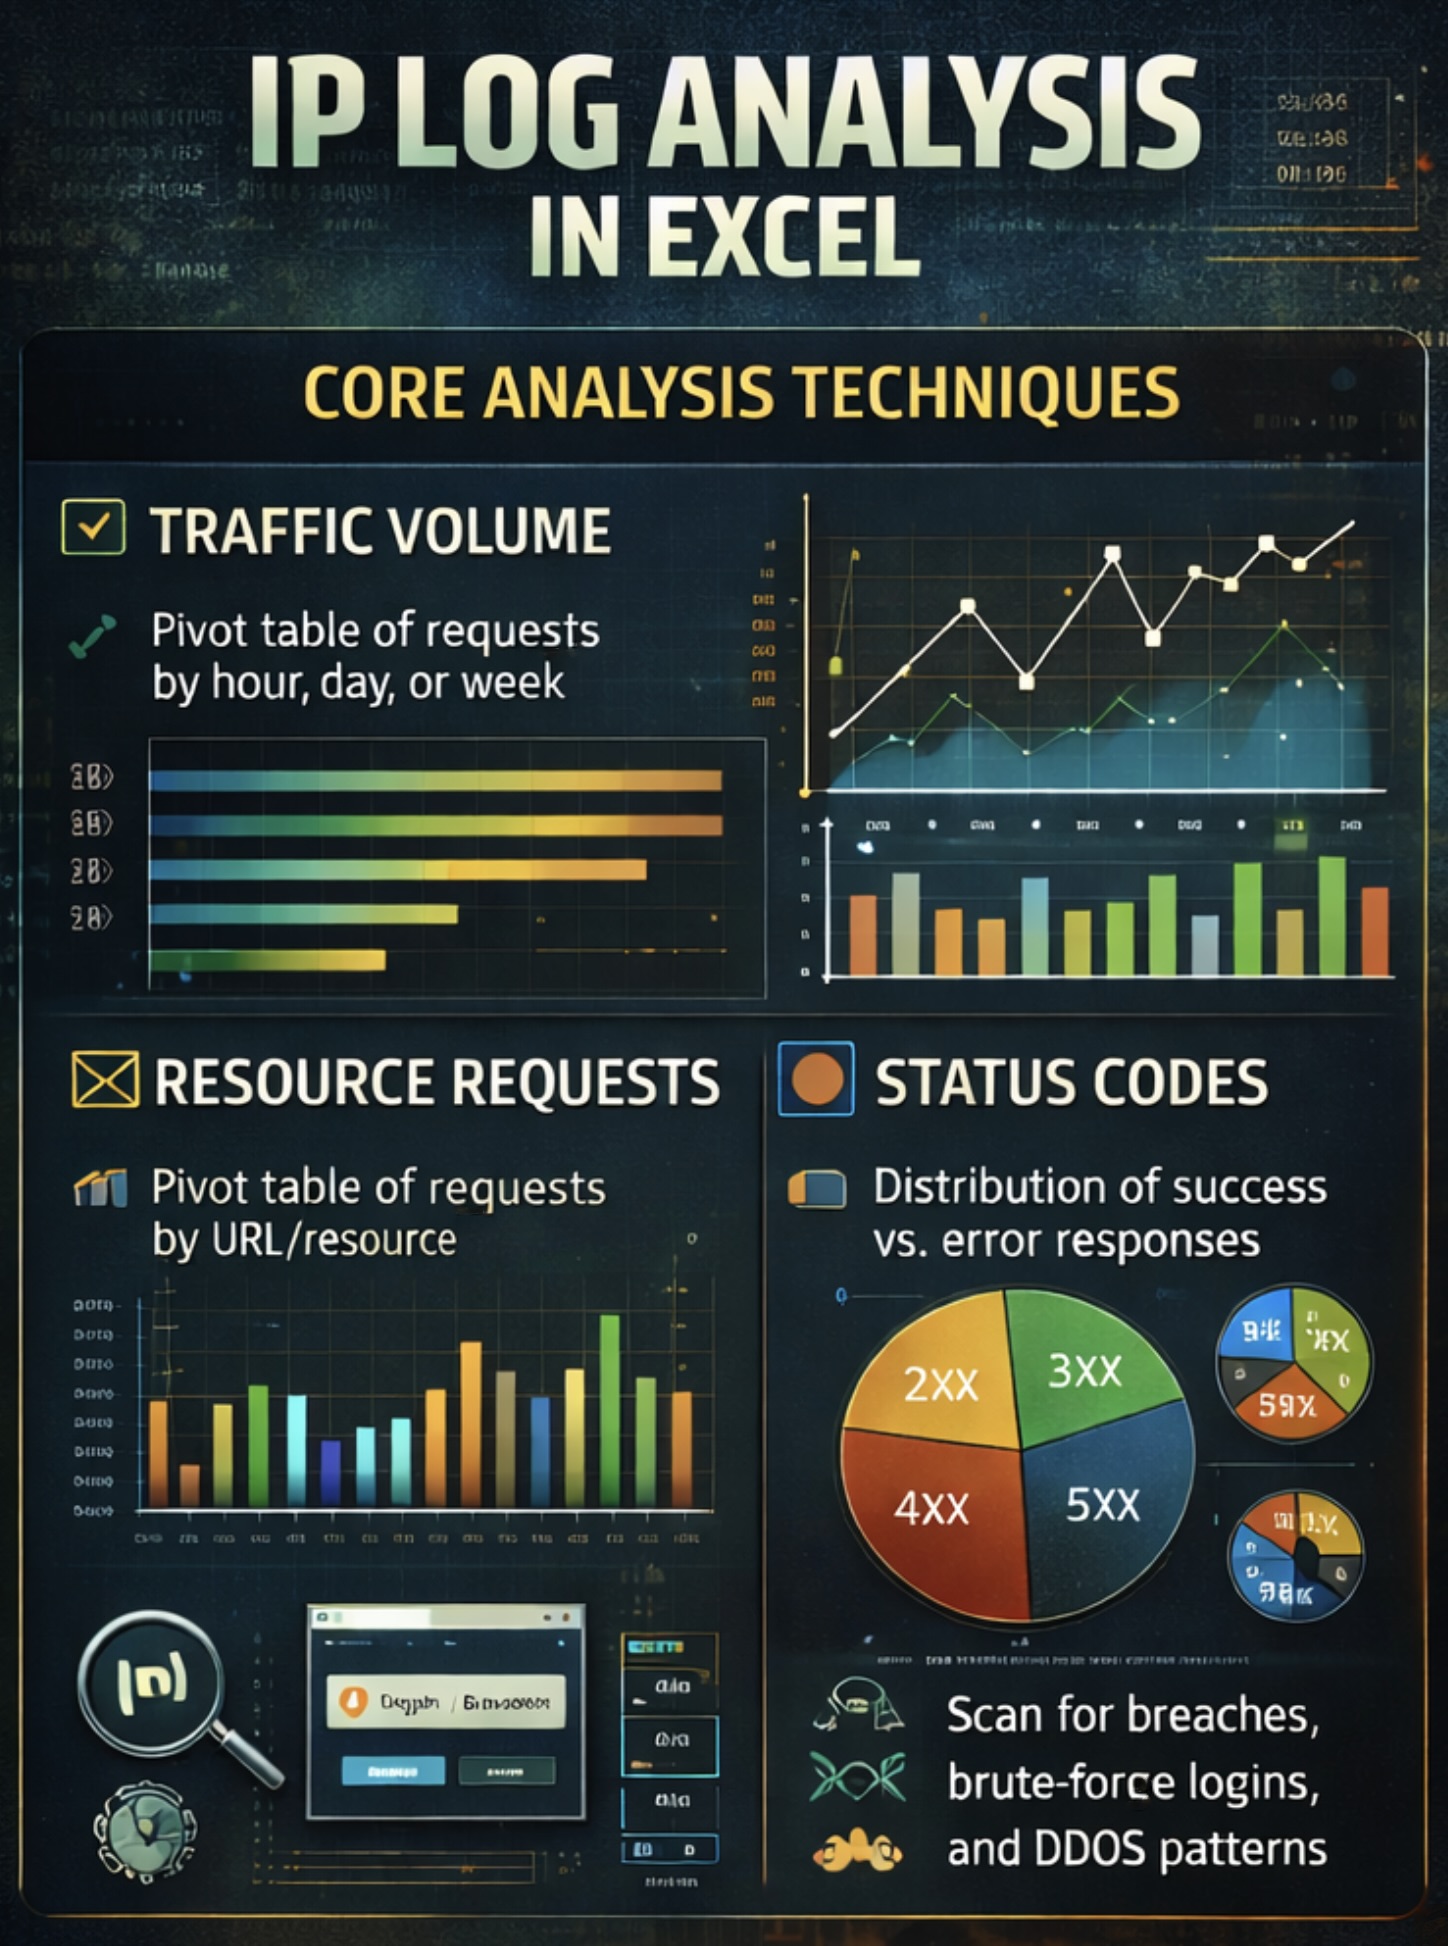
Image generated by ChatGPT.
Traffic Volume Analysis
The most fundamental question: how much traffic are you receiving, and when?
Create pivot tables showing requests by hour, day, or week:
- Rows: Date/Hour extracted from timestamp
- Values: Count of requests
- Filter: Remove error codes (4xx, 5xx) if analyzing successful traffic only
This reveals traffic patterns—peak hours, weekday-versus-weekend differences, and sudden spikes indicating potential attacks or viral content.
Calculate Bandwidth Consumption
Sum the bytes transferred column, segmented by time period or resource requested. Convert to megabytes or gigabytes for readability: =SUM([Bytes])/1024/1024 (for MB)
Understanding bandwidth distribution helps identify resources that consume disproportionate capacity.
Geographic and IP Analysis
Identify the Top-Requesting IP Addresses
Create a pivot table with IP addresses as rows and the request count as values. Sort descending to see the most active IPs.
Excessively high request counts from single IPs often indicate:
- Scrapers harvesting content
- DDoS attacks
- Misconfigured applications making repeated requests
- Security scanning tools probing for vulnerabilities
Geographic Insights Require IP Geolocation
While Excel doesn't include built-in geolocation, you can use VLOOKUP with IP geolocation databases. Free databases like GeoLite2 provide country-level data. Convert the database to Excel format, then use the IP address to look up country codes.
More sophisticated analysis requires converting IP addresses to numeric values and using range lookups, as geolocation databases provide IP ranges rather than individual addresses.
Resource Request Analysis
Identify the Most-Requested Resources
Parse the request field to extract only the URL path (removing the HTTP method and protocol version). Create a pivot table showing request counts by resource.
This reveals:
- Your most popular content
- Resources generating errors (cross-reference with status codes)
- Uncommon requests potentially indicating intrusion attempts (requests for /admin, /wp-login.php on non-WordPress sites, etc.)
Status Code Distribution
Analyze HTTP status codes to understand request outcomes:
- 2xx codes: Success
- 3xx codes: Redirects
- 4xx codes: Client errors (404 not found, 403 forbidden)
- 5xx codes: Server errors
High 4xx rates suggest broken links or users attempting to access non-existent resources. High 5xx rates indicate server problems requiring investigation.
Referrer Analysis
The referrer field shows where traffic originates—direct visits, search engines, social media, or other websites.
Extract the domain from full referrer URLs using text functions: =MID([@Referrer],FIND("//",[@Referrer])+2,FIND("/",[@Referrer],FIND("//",[@Referrer])+3)-FIND("//",[@Referrer])-2)
This extracts "google.com" from "https://google.com/search?q=example"
Analyzing referrer domains reveals:
- Top traffic sources
- Unexpected referrers (potentially indicating security issues or unauthorized linking)
- Marketing campaign effectiveness (if using UTM parameters)
User Agent Analysis
User agent strings identify browsers, operating systems, and devices. While cryptic, they contain valuable intelligence.
Extract Browser Types
Use nested IF statements or SEARCH functions: =IF(ISNUMBER(SEARCH("Chrome",[@[User Agent]])),"Chrome",IF(ISNUMBER(SEARCH("Firefox",[@[User Agent]])),"Firefox","Other"))
Expand this to categorize all major browsers.
Identify Mobile Versus Desktop
Search for mobile indicators ("Mobile", "Android", "iPhone"): =IF(OR(ISNUMBER(SEARCH("Mobile",[@[User Agent]])),ISNUMBER(SEARCH("Android",[@[User Agent]])),ISNUMBER(SEARCH("iPhone",[@[User Agent]]))),"Mobile","Desktop")
Understanding device distribution informs design and optimization priorities.
Security Event Detection
IP logs often reveal security threats before they cause damage.
Identify Scanning Activity
Look for sequential requests from a single IP testing multiple URLs, especially administrative paths:
- /admin, /administrator, /wp-admin
- /login, /user/login, /auth
- /.env, /config, /.git
Create calculated checks for these patterns, and filter requests from IPs making suspicious requests.
Detect Brute-Force Attempts
Multiple failed authentication attempts (401 or 403 status codes) from the same IP address targeting login endpoints indicate password-guessing attacks.
Use pivot tables to show IP addresses with high counts of 401/403 responses for login URLs.
Spot DDoS Patterns
Sudden spikes in requests, especially from multiple IPs in the same subnet or with similar user agent strings, suggest distributed denial-of-service attacks.
Time-based analysis showing requests per minute helps identify these spikes.
Building Analytical Dashboards
Once you've cleaned and categorized your data, create visual dashboards for at-a-glance insights.
Key visualizations:
- Traffic over time (line chart): Shows trends, spikes, and patterns. Use daily or hourly granularity depending on your traffic volume.
- Top IP addresses (bar chart): Horizontal bar chart showing request counts from the most active IPs.
- Geographic distribution (map or bar chart): If you've added geolocation data, visualize traffic by country.
- Status code breakdown (pie chart): Shows the proportion of successful versus error responses.
- Resource popularity (bar chart): Top 20 most requested resources.
- Device/browser distribution (stacked column chart): Desktop versus mobile traffic over time.
Arrange these on a dashboard worksheet with slicers allowing filtering by date range, status code, or other dimensions. This creates an interactive analysis tool usable by non-technical stakeholders.
Session Reconstruction
Group sequential requests from the same IP within a time window (typically 30 minutes) to reconstruct user sessions. This reveals navigation patterns and typical user journeys through your site.
Anomaly Detection
Calculate average requests per hour and standard deviation. Flag periods exceeding 2-3 standard deviations as anomalies requiring investigation.
Cohort Analysis
Track groups of IPs that appeared during specific time periods to understand retention and repeat visitor patterns.
Correlation Analysis
Cross-reference log patterns with business metrics (sales, signups, conversions) to identify traffic sources or times correlating with valuable outcomes.
Mastering these analytical patterns requires comfort with Excel's more advanced capabilities—nested formulas, array functions, pivot table calculated fields, and complex conditional logic. The jump from basic filtering to sophisticated log analysis involves not just knowing individual functions but understanding how to combine them into analytical workflows. Therefore, advanced Excel training with datasets that resemble real-world structures—messy timestamps, inconsistent formatting, missing values—may help build the problem-solving intuition that separates competent analysts from those who struggle when data doesn't cooperate.
Real-World Applications
Small Business Security Monitoring
A retail website owner notices in her weekly log analysis that a single IP address made 47,000 requests over two days—98% of them to the checkout page, all returning errors. This reveals an attempt at a shopping cart exploit. She blocks the IP range and patches the vulnerability before any customer data is compromised.
Content Strategy Optimization
A blogger analyzing referrer data discovers that an obscure forum consistently sends highly engaged traffic (long session durations, multiple page views). He joins the community, building relationships that triple his traffic over six months.
Infrastructure Capacity Planning
An IT manager's hourly traffic analysis reveals that request volumes peak between 10 and 11 AM, frequently approaching server capacity limits. He schedules automated scaling to activate at 9:45 AM, preventing slowdowns from affecting users.
Fraud Detection
An e-commerce analyst identifies that orders from a specific IP subnet consistently result in chargebacks. Geographic analysis shows they're from a known fraud hotspot. The company implements additional verification for orders from that region, reducing fraud losses by 40%.
Conclusion
IP logs contain extraordinary intelligence about your digital infrastructure: who's visiting, what they're doing, where problems exist, and where threats lurk. The challenge isn't collecting this data; modern servers generate it automatically. The challenge is transformation, turning megabytes of cryptic text into insights that drive decisions.
Excel provides accessible, cost-effective log analysis capabilities that serve small businesses, independent consultants, researchers, and analysts without massive budgets. With proper techniques and functions, you can extract the same fundamental insights that enterprise tools provide at a fraction of the cost and complexity.
Featured Image generated by ChatGPT.
Share this post
Author

Read the latest articles from Thomas Lore
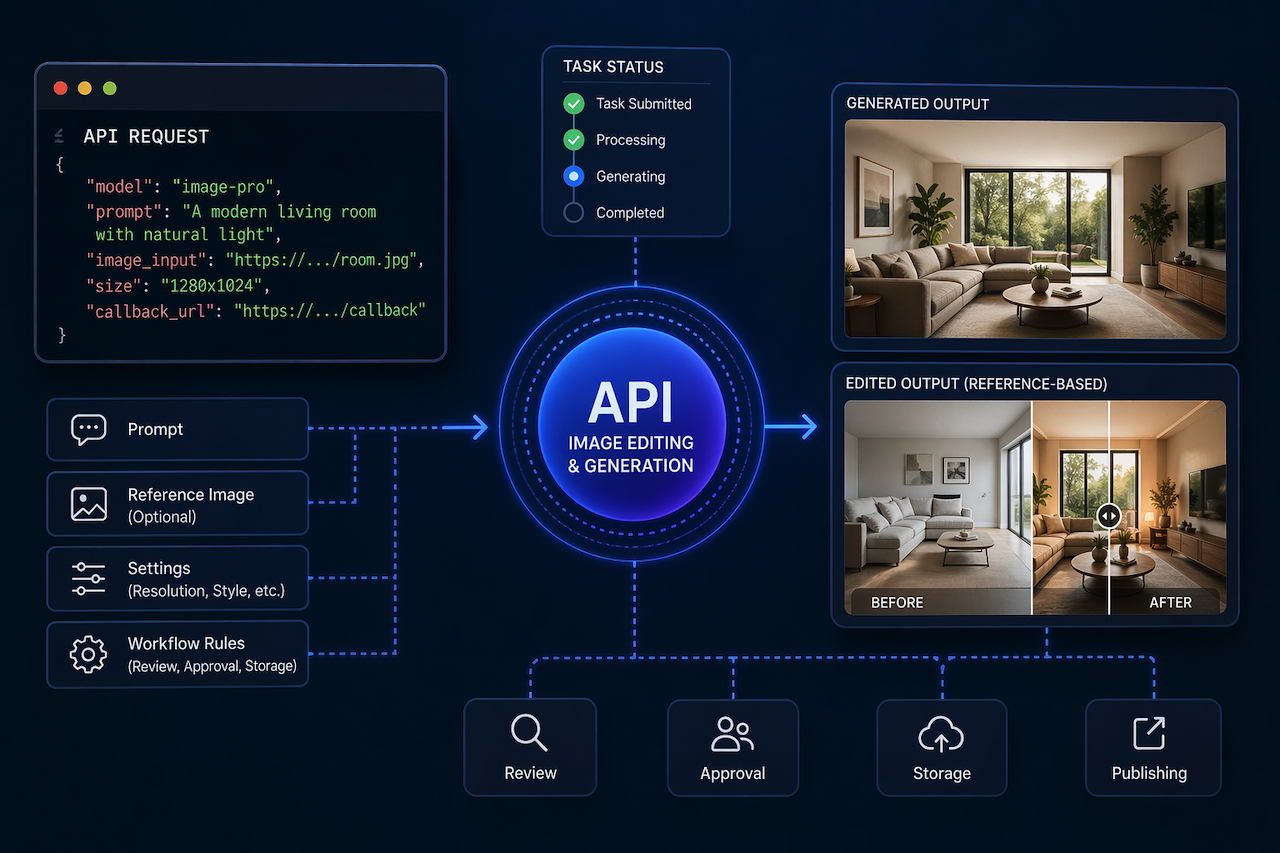
Nano Banana Pro API Integration Guide for Image Editing and Generation
April 23, 2026
Image workflows become difficult to maintain when editing and generation remain disconnected from the rest of the production process. Many teams can test an endpoint once, get a result, and call that success. Real integration starts later, when image requests repeat, output has to move through review, and the wor [...]
Learn moreHow Developers Can Use The GPT 5.4 API To Build Smarter Web Tools And Automation Workflows

April 1, 2026
Web tools are no longer limited to static lookups, rule-based automation, or narrow search functions. Developers today are building products that must interpret user intent, summarize content, generate structured responses, and automate repetitive tasks, all with far greater flexibility. That shift is one reason [...]
Learn moreLeave a comment
All comments are moderated. Spammy and bot submitted comments are deleted. Please submit the comments that are helpful to others, and we'll approve your comments. A comment that includes outbound link will only be approved if the content is relevant to the topic, and has some value to our readers.
Comments (0)
No comment