

Games, Productivity, Online Tools
When Will You Reach Level 60? Forecasting WoW Forever Progress With a Burndown Chart
WoW Forever is a World of Warcraft version with a level cap of 60. It launched on November 4, 2026. The 1st raids open on December 9, 2026. For a player who wants to raid on opening day, that date is a deadline.
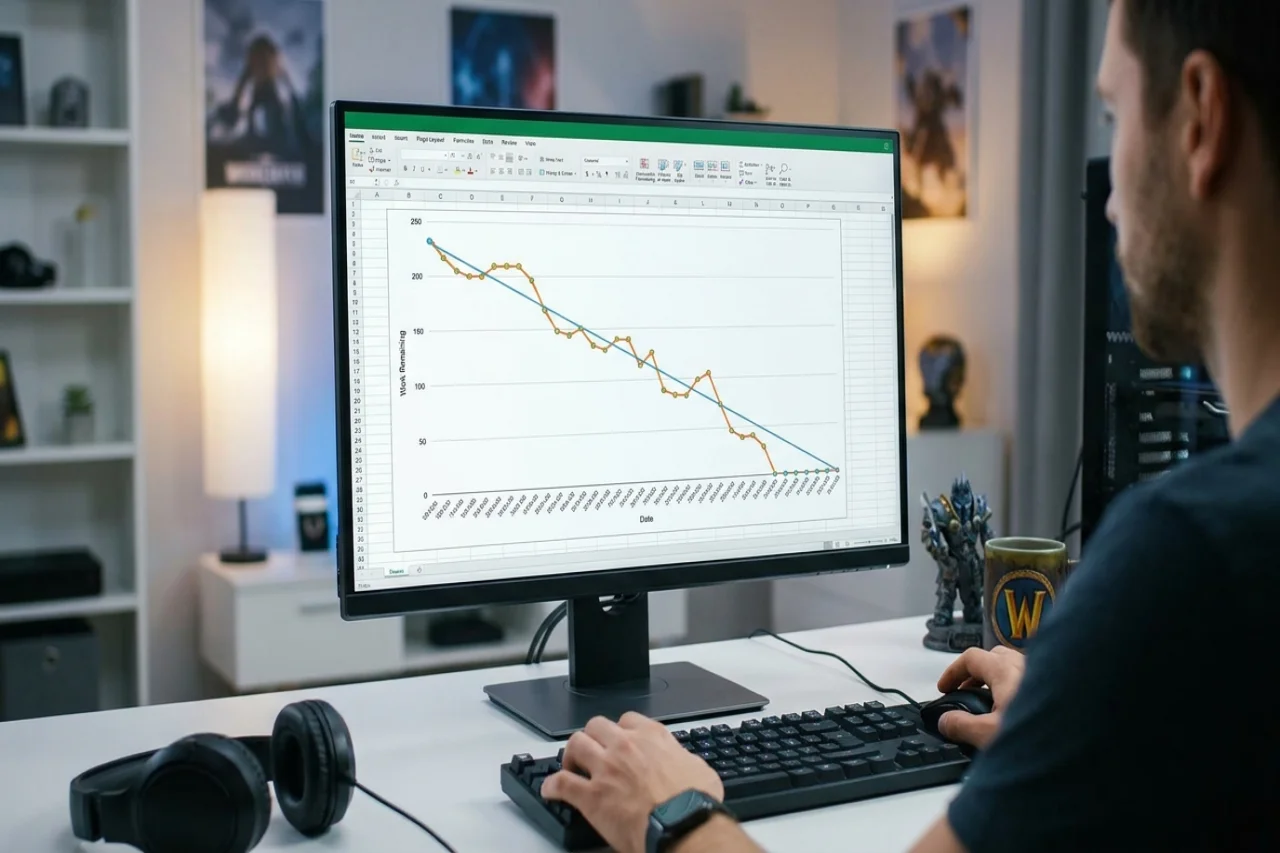
A burndown chart gives you a forecast date to compare with that deadline. You log your sessions in a spreadsheet, 1 row a day, and chart the XP you still need. A trend line through the points shows the day on which the figure reaches 0. This tutorial builds the chart step by step in Google Sheets or Excel.
What a Burndown Chart Answers
In software project management, a burndown chart tracks the work left in a project. The vertical axis shows the work remaining. The horizontal axis shows time. As the team finishes tasks, the line falls toward 0.
Leveling fits the same shape. The work left is the XP still needed to reach 60, burned a little in each session. The slope of the line is your pace. The day it reaches 0 is your forecast date.
The chart counts XP. Levels make for an uneven unit because each level usually requires more XP than the one before. XP puts every session on the same scale.
Build the Session Log
Open a new sheet with 4 columns. Row 1 holds the headers. Row 2 holds Day 1, so a 10-day log fills rows 2 to 11. Add 1 row at the end of each day.
- Column A: the date, formatted as a date.
- Column B: hours played that day.
- Column C: XP still needed to reach 60 at the end of that day.
- Column D: a short note, such as the level reached or a dungeon cleared with its quests.
Keep the data clean. Enter plain numbers in columns B and C, with no text or units. A day with no play gets 0 hours and the same XP figure as the day before. Check each entry, since 1 wrong digit can bend the trend line.
Estimate the XP Still Needed
Column C asks for the XP still needed to reach 60. The XP bar shows your progress through the current level and the XP required for that level. You can build the full figure from the bar alone, in 4 steps.
- When you reach a new level, note the XP the bar shows that level needs.
- Extend that trend for the levels ahead, up to level 59. Each level usually asks a little more than the last.
- Add what is left of the current level to the sum of the levels ahead.
- Refresh the estimate at every new level with the real figure you just noted.
A side table does the arithmetic. Put each level you have seen in column F and the XP it needs in column G. With 8 levels in rows 2 to 9, =FORECAST.LINEAR(30, G2:G9, F2:F9) projects the XP that level 30 needs. The SUM function then adds the projections for the levels ahead to the remainder of the current level.
Chart the Log and Find the Forecast Date
The worked example starts here, and every number in it is example data. The XP figures are invented round values. The example player starts at level 1 on Day 1, November 5, 2026, with an estimated 3,600,000 XP still needed. The log runs 10 days, through November 14.
Days 1 to 5 (November 5 to 9) log 5, 4, 3, 6 and 3 hours. XP still needed at the end of those days reads 3,520,000; 3,450,000; 3,390,000; 3,250,000; and 3,190,000. Days 6 to 10 (November 10 to 14) log 4, 5, 3, 4, and 3 hours. Their XP still needed reads 3,110,000; 2,990,000; 2,930,000; 2,860,000; and 2,800,000.
In total, the log holds 40 hours and 800,000 XP gained (3,600,000 minus 2,800,000). Days 4 and 7 include 1st dungeon clears with their quests. They show as the 2 biggest drops, 140,000 and 120,000 XP.
Select columns A and C and insert a line chart. The date runs along the horizontal axis, and XP still needed runs up the vertical axis. Then add a linear trend line in the chart settings.
The same line also comes from 2 formulas. SLOPE and INTERCEPT take the y values before the x values, so column C comes before column A. =SLOPE(C2:C11, A2:A11) is the XP burned per day, a negative number because the line falls. In the example, it comes to about -83,000 XP a day.
Spreadsheets store each date as a day number. =INTERCEPT(C2:C11, A2:A11) is the line's height at day number 0, far in the past. The forecast combines both formulas: =-INTERCEPT(C2:C11, A2:A11)/SLOPE(C2:C11, A2:A11). Format that cell as a date to read the day the line reaches 0.
Read the Forecast
In the example, the forecast cell shows December 17, 2026. Hours played give a 2nd view. XP per hour is the total XP gained divided by the total hours played. Here, 800,000 XP over 40 hours is 20,000 XP an hour.
Hours still needed is the Day 10 figure divided by XP per hour, so 2,800,000 XP takes 140 hours. From the end of Day 10 (November 14) to December 9 is 25 days, about 3.6 weeks. Fitting 140 hours into 3.6 weeks takes 39 hours a week. The log shows 28 hours a week (40 hours over 10 days).
The trend line reaches 0 on December 17, which is 8 days after the raids open on December 9. About 11 extra hours a week would bring level 60 to December 9. A higher XP rate per hour would also bring the date closer. Speedrunner routes for WoW Forever leveling may also incorporate dungeon runs.
That route covers the quests through the new zones in order, plus 1 clear of every dungeon with its quests. It takes about 150 in-game hours to go from 1 to 60, a reference point for your own XP per hour. With the example's 3,600,000 XP for the full climb, that works out to 24,000 XP an hour. At 20,000 XP an hour, the example player's climb comes to 180 hours.
Refine the Forecast
Early levels go fast. On those days, the estimate in column C rests on only a few small levels. A straight line drawn from the early days can be too optimistic.
A rolling window of the last 7 days gives a fairer pace. Point the formula at rows 5 to 11: =-INTERCEPT(C5:C11, A5:A11)/SLOPE(C5:C11, A5:A11). In the example, the window gives a slope of about -78,000 XP a day and a forecast of December 19. Move the window down as new rows arrive.
Mark level 40 as a checkpoint. Dual spec opens there. Riding (60%) and a mount come at the same level.
Your XP still needed at level 40 is the estimate for levels 40 to 59. Put that value in every row of column E and add it to the chart as a flat line. The date where the trend line meets it is your level-40 forecast. The formula =(E2-INTERCEPT(C2:C11, A2:A11))/SLOPE(C2:C11, A2:A11), formatted as a date, gives that day.
Dungeon quests pay extra XP, so each 1st clear with its quests shows as a step in the line. The climb to 60 passes 9 new dungeons, from Hall of Thanes (levels 13-18) to Shaper's Terrace (levels 58-60). Note every clear in column D. The steps then make sense when you read the chart weeks later.
Refresh the forecast every week. Extend the ranges to the newest rows and check the level estimate behind column C. A date that moves later still helps, because it shows the gap while there is time to close it. The same 4 columns work for any long-term goal with a measurable total.
Final Thoughts
A burndown chart provides a practical way to track leveling progress and estimate whether a target date is achievable. By recording daily XP, monitoring trends, and adjusting estimates as new data becomes available, players can make more informed decisions about their time. Although forecasts may change as leveling difficulty increases, the same spreadsheet method can be applied to other gaming milestones and measurable goals.
Disclaimer
This article is provided for informational and educational purposes only. All trademarks and game-related names belong to their respective owners.
iplocation.net does not guarantee the accuracy of game information, leveling estimates, timelines, or third-party services referenced in this article. Readers are responsible for verifying information and ensuring that their activities comply with applicable laws and game terms of service. To the extent permitted by applicable law, iplocation.net disclaims liability for any losses, account restrictions, service disruptions, or other consequences arising from reliance on this content or the use of third-party services.
Comments
Comments are available to signed-in users and are moderated to keep the discussion useful and respectful. Spam, automated submissions, and low-value promotional comments are removed. Outbound links may be approved when they are relevant and genuinely helpful to readers, but they are displayed as plain text rather than clickable hyperlinks.
No comments have been published yet.
Please sign in to submit a comment.