

IP Address, Geolocation, Data & Database
Three tests for a dataset you did not build
Anyone who has compared two IP geolocation databases knows the shape of the problem. Both quote a high accuracy figure. Neither shows the working. You are asked to pick one based on a number that cannot be verified.
The useful question is not which claim is larger. It is what the evidence would settle.
Evaluating an IP geolocation database requires examining more than its advertised accuracy. Independent validation, coverage transparency, and consistency across geographic regions can provide a clearer picture of data reliability. These principles apply to other types of datasets as well. Tennis match statistics offer a practical example of how researchers can test data quality by comparing established benchmarks, identifying missing records, and analyzing differences across categories.
Does it reproduce something it was not built for?
A measurement tuned to hit a known figure will hit it. A measurement that lands on one by accident is doing something else.
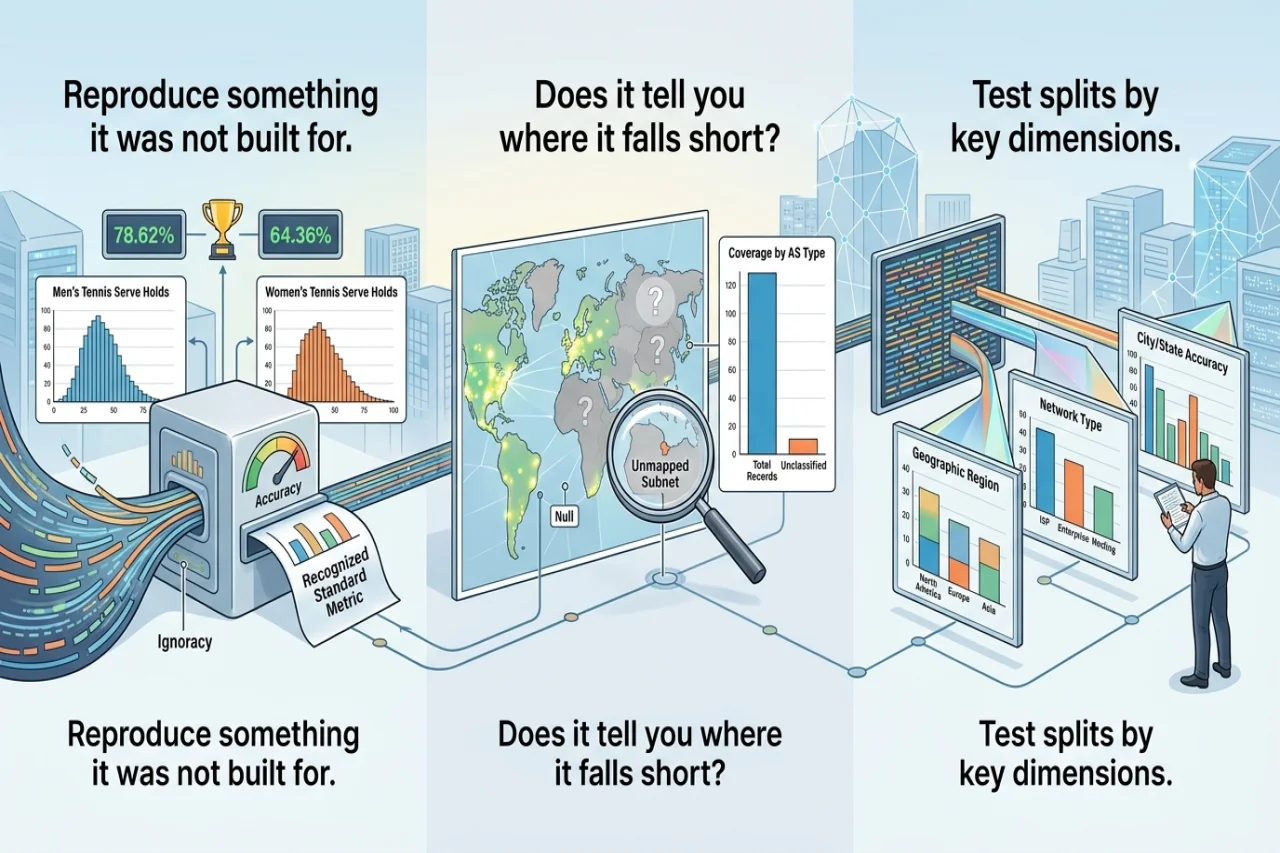
Across 2,239,440 service games, men's professional players hold serve 78.62% of the time, from 230,715 games. Women's professional players hold 64.36% of games, from 266,503 games. The rates published elsewhere for those two tours sit at about 79% and about 64%.
The method behind those figures was tuned to neither. It counts games from the match record and excludes tiebreaks, and nothing in it was adjusted until the answer looked familiar. Landing on both is the check.
One reproduction can be a coincidence. Consistent results across different categories provide stronger evidence of reliability. The same principle applies to IP geolocation databases. Comparing reported locations against independently verified reference data can help determine whether a provider's accuracy claims hold across different geographic regions and network types.
Does it tell you where it falls short?
This is the test most vendors fail, and it costs nothing to apply.
The surface breakdown above is drawn from 2,239,440 service games. The tour breakdown covers 2,294,737. The difference of 55,297 games is matches whose surface the feed never stated. The dataset says so, in a note attached to the figure.
Transparent reporting of missing data is essential when evaluating dataset reliability. For IP geolocation databases, coverage gaps may involve addresses with incomplete location information, outdated records, or geographic regions with limited reference data. An advertised accuracy percentage provides little context without explaining the sample size, measurement criteria, and exclusions. Understanding these limitations helps organizations determine whether a dataset is suitable for their intended use.
Does it survive being split?
A single headline figure is an average, and an average is only safe when the thing underneath it is uniform.
Hold rates by surface run 74.43% on grass, from 74,673 games. Hard courts give 69.95% from 1,222,994 games, and clay 65.98% from 941,773 games. That is a spread of 8.45 percentage points. Any one figure offered as the normal hold rate is wrong somewhere by a wide margin.
Now take an independent measure of the same thing. Tiebreaks occur in 31.73% of grass matches, 25.28% of hard court matches, and 22.52% of clay matches. Grass is highest, clay is lowest, in the same order as the hold rates.
These results illustrate why examining multiple measurements and categories can reveal patterns that a single average may conceal. Similar considerations apply to IP geolocation databases, where accuracy can vary by country, region, network provider, and IP address type. Evaluating these differences helps determine whether a dataset performs consistently across the locations and networks relevant to a particular application.
What to ask an IP geolocation data provider
Before selecting an IP geolocation database, organizations should consider three questions that help assess the reliability of its accuracy claims.
- How does the database perform when its location estimates are compared against independently verified reference data?
- What geographic regions, IP address ranges, or network types have limited coverage or incomplete information?
- How does the reported accuracy change when results are analyzed by country, region, IP address type, or network provider?
A source that can answer all three is showing you its working. A source that answers none is selling you a number.
Conclusion
Evaluating third-party data requires more than comparing advertised accuracy percentages. Independent validation, transparent coverage reporting, and consistent results across different categories provide a stronger basis for assessing reliability. For IP geolocation databases, this means examining how accuracy varies across geographic regions, IP address types, and network characteristics, rather than relying solely on a single headline figure. These principles can help organizations make more informed decisions when selecting external data sources.
The statistical figures referenced in this analysis are derived from tennis match data provided by Live Tennis API. The dataset is published under the Creative Commons Attribution 4.0 International (CC BY 4.0) license, which permits reuse with appropriate attribution.
Method: Completed best-of-three professional singles matches on the ATP, WTA, Challenger and ITF tours, 1 January 2023 to 14 September 2026. Retirements and walkovers excluded. Tiebreak games excluded from hold rates.
Comments
Comments are available to signed-in users and are moderated to keep the discussion useful and respectful. Spam, automated submissions, and low-value promotional comments are removed. Outbound links may be approved when they are relevant and genuinely helpful to readers, but they are displayed as plain text rather than clickable hyperlinks.
No comments have been published yet.
Please sign in to submit a comment.