

Geolocation, Business, Data & Database
Outside-In Analysis: How to See the Demand Your Analytics Can't

Every analytics stack I've worked with shares one boundary. It starts measuring at the moment someone arrives. Sessions, carts, tickets, inbound calls, CRM records: all of it describes people who already found you.
The people who searched, compared, and picked someone else never enter that record. They aren't a rounding error either. In a category with a dozen viable providers inside a ten-mile radius, most of the demand in that radius resolves somewhere other than your business, and none of it lands in your reporting.
Outside-in analysis is the practice of reconstructing that missing half from public signals. It's a discipline with real methods and real limits, and both are worth understanding before you buy a tool that promises it.
The measurement boundary in a first-party stack
First-party analytics is a closed system by design. It observes events that happen on surfaces you control: your site, your booking flow, your phone system, your point of sale. That's the correct scope for the questions it's built to answer, like which page leaks conversions or which channel produced this month's orders.
The scope becomes a problem when the question changes. Your reporting is accurate about what happened. It has nothing to say about what didn't. If a customer in the next town searched for a service you could deliver, found three competitors listing it and you not listing it, and booked one of them, your systems record silence, and silence reads exactly like no demand.
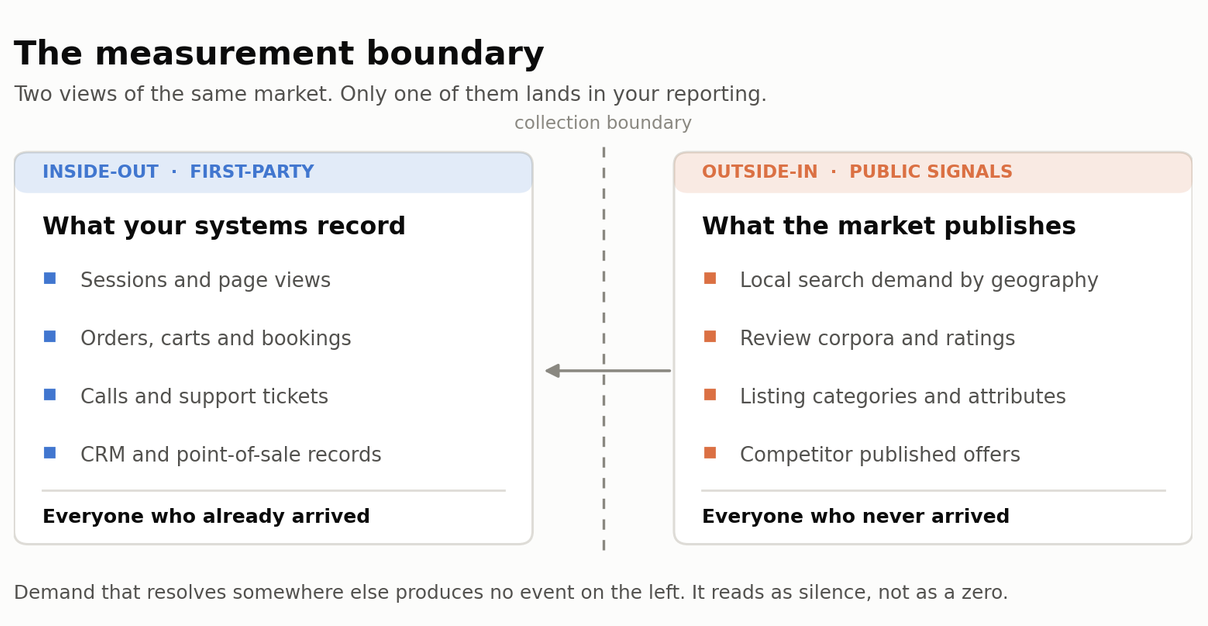
Figure 1. Inside-out and outside-in views of the same market. First-party systems only observe people who already arrived; public signals describe the demand that resolved somewhere else.
Where outside-in data actually comes from
Four public sources carry most of the useful signal. None of them require credentials, and none of them are behind a login.
1. Search and demand signals by geography
Query volume and query composition both vary by location. A term that's dominant in one metro can be near-absent forty miles away, and category vocabulary drifts regionally in ways that surprise operators.
Demand also refuses to hold still. Ben Gomes, then VP of Engineering at Google, wrote in 2017 that 15% of searches seen every day are new. That's a useful correction to the idea that you can map a keyword universe once and be done. The demand surface is a moving object, which is why outside-in work is a repeated measurement rather than a one-off report.
Google Trends gives free relative-interest data by metro, and it's an honest starting point for anyone who wants to test this without buying anything.
2. Review corpora
Reviews are the largest public record of customer experience ever assembled, and they're readable in bulk.
BrightLocal's 2026 Local Consumer Review Survey, run on a panel of 1,002 US adults, found that 97% of consumers read reviews for local businesses, 68% now require a rating of at least four stars before they'll use a business, and 74% look specifically for reviews from the last three months. Recency has tightened noticeably year over year.
The commercial consequence has been measured rather than asserted. In Michael Luca's Harvard Business School research on reviews, reputation, and revenue, a one-star increase in Yelp rating was associated with a 5 to 9% increase in revenue, with the effect concentrated among independent restaurants and absent for chain-affiliated ones. That asymmetry matters: the businesses with the least analytical tooling are the ones whose revenue is most exposed to a public dataset they don't monitor.
3. Listing and presence data
Every listing source publishes a structured profile: categories, attributes, hours, service lists, photos, and a last-updated signal. It's self-reported and frequently stale, which limits what you can conclude from it.
What it's good for is absence detection. A service your comparison set publishes, and you don't, is a concrete, checkable difference, and absence is the one thing internal analytics structurally cannot show you.
4. The competitor public surface
Menus, service pages, spec sheets, pricing pages and category taxonomies are all published deliberately. Read as a corpus rather than one competitor at a time, they describe what a market currently believes it sells.
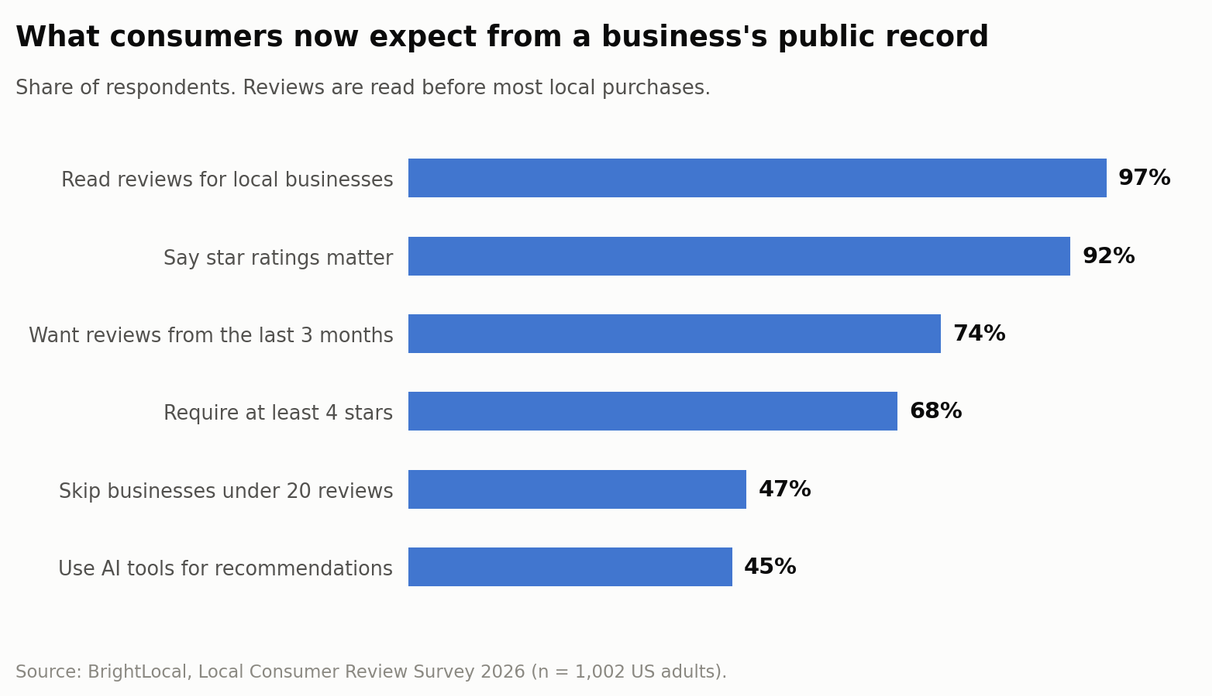
Figure 2. Consumer standards applied to a business's public record, from BrightLocal's Local Consumer Review Survey 2026 (n = 1,002 US adults).
Geography is a parameter, not an accident
This is where outside-in collection goes wrong most often, and it's the part with the strongest technical content.
Search results are localized. The same query issued from two cities returns different businesses in a different order, so "our ranking" is not a single number. It's a distribution across the places you serve. Any collection design that ignores that produces a confident answer to a question nobody asked.
Two practical consequences follow.
First, set location explicitly. If a collector runs from one office or one cloud region, you get that location's answer and nothing else. The location the platform infers from an IP address is a default, not a choice, and defaults are how a business in a five-county service area ends up tuning everything to one zip code.
Second, respect the accuracy gradient. IP geolocation is close to reliable at country level and materially less so at city level, with accuracy varying by network type, carrier NAT, corporate egress, and VPN use. That gradient is fine if you treat location as a variable you set and record, and it's a quiet source of error if you treat inferred location as ground truth. For anyone doing this work, the useful habit is to log the location you requested alongside every collected artifact, so results stay reproducible.
How an outside-in pass runs
The method is unglamorous, and it holds up.
- Define the geography set: List the places you actually serve, at the granularity you serve them. This is a business decision, not a technical one.
- Define the comparison cohort: Decide which businesses count as alternatives from a customer's position, not from yours. Cohort definition is the single largest source of disagreement in this work.
- Collect public artifacts only: Listings, reviews, published pages, public search results. No credentials, no logins, nothing behind authentication. Honor robots directives and rate limits.
- Normalize, compare, then quantify with the assumptions visible: Any number you produce is the output of a model, and the model has to be inspectable.
The honest limits
Anyone selling you outside-in analysis should be able to recite these without prompting.
- Search interest is a proxy for intent, not a measurement of it. A query is not a customer.
- Review corpora are a biased sample. People with strong feelings write reviews, and the volume of reviews reflects prompting practices as much as customer count.
- Listing data is self-reported and often stale. Absence in a directory does not prove absence in reality.
- Geolocation resolution degrades below the city level, so sub-metro conclusions need care.
- Cohort definition is a judgment call, and moving one business in or out can move a conclusion.
- Dollarizing a gap is modeling, not measurement. Turning "you don't list this service and four comparable businesses do" into a revenue figure requires assumptions about demand volume, conversion, and margin. Those assumptions must travel with the number.
I'll declare my interest here. I work in this space, and Ontevo is one example of an outside-in approach that uses public data without requiring system access or credentials. The reason I'm insistent about the limits is that they're central to the discipline. A gap that can't show its arithmetic isn't a finding; it's an opinion with a number attached. That's the standard behind Ontevo's framing of revenue leak intelligence, and it's the standard I'd hold any outside-in analysis to, including my own.
A pass you can run this week
Three steps, no vendor required.
- Run your primary category query: Run the query from three locations you serve, setting the location explicitly rather than inheriting it, and record which businesses appear.
- Compare review data: Pull review count, average rating, and most recent review date for yourself and everyone who appeared alongside you, then compare against the thresholds in the BrightLocal data above. If your most recent review is older than three months, you're outside what most consumers now look for.
- Identify service or product gaps: List every service or product your comparison set publishes that you don't, sorted by how many of them publish it. Anything that appears on most of the list and none of yours is worth a conversation.
None of that needs a budget or a login. It needs treating the data outside your systems as data.
Conclusion
First-party analytics can tell me what happens once customers reach a business, but it can't fully capture the demand, comparisons, and decisions happening outside those systems. That's where I find outside-in analysis useful. By looking at public signals such as search behavior, reviews, listings, and competitor information across relevant locations, I can build a broader picture of what the market is doing beyond the boundaries of internal reporting.
I don't treat those signals as ground truth. They come with limitations, which is why the assumptions, collection methods, and arithmetic behind any conclusion need to stay visible. Used alongside first-party analytics rather than as a replacement for them, outside-in data can reveal gaps that internal systems alone were never designed to show.
Comments
Comments are available to signed-in users and are moderated to keep the discussion useful and respectful. Spam, automated submissions, and low-value promotional comments are removed. Outbound links may be approved when they are relevant and genuinely helpful to readers, but they are displayed as plain text rather than clickable hyperlinks.
No comments have been published yet.
Please sign in to submit a comment.